
Key Takeaways
- In the past 5 years Apple's services revenue has grown 6x from $11bn in 2016 to $68bn in 2021. Services now constitute ~20% of revenue.
- iPhone revenue hit record highs, $191bn for the 2021 financial year, up 39% year on year. In 2021 they sold an estimated ~250,000 phones.
- iPad revenue jumped 34% in 2021 to ~$32bn closing the gap on Mac sales which amounted to $35bn.
- Strongest growth region 2021 vs 2020 was China, where revenue is up 70%, in part due to the strength of the Yuan.
Apple Statistics
Apple's fiscal year typically begins in early late September/October and concludes in late September/early October. Below when referring to year we are referring to their financial year
Table Of Content
Apple's Total Revenue
Apple has historically had a good first quarter, which covers the period October to December in their financial year.
| Year | Revenue (billion) |
|---|---|
| 2016 | $215.6 |
| 2017 | $229.2 |
| 2018 | $265.6 |
| 2019 | $260.2 |
| 2020 | $274.5 |
| 2021 | $365.8 |
Apple achieved 33% year on year growth in top-line revenue taking in $91 billion more in 2021 than the year prior.
Earnings Per Share (Diluted)
Apple Revenue By Country
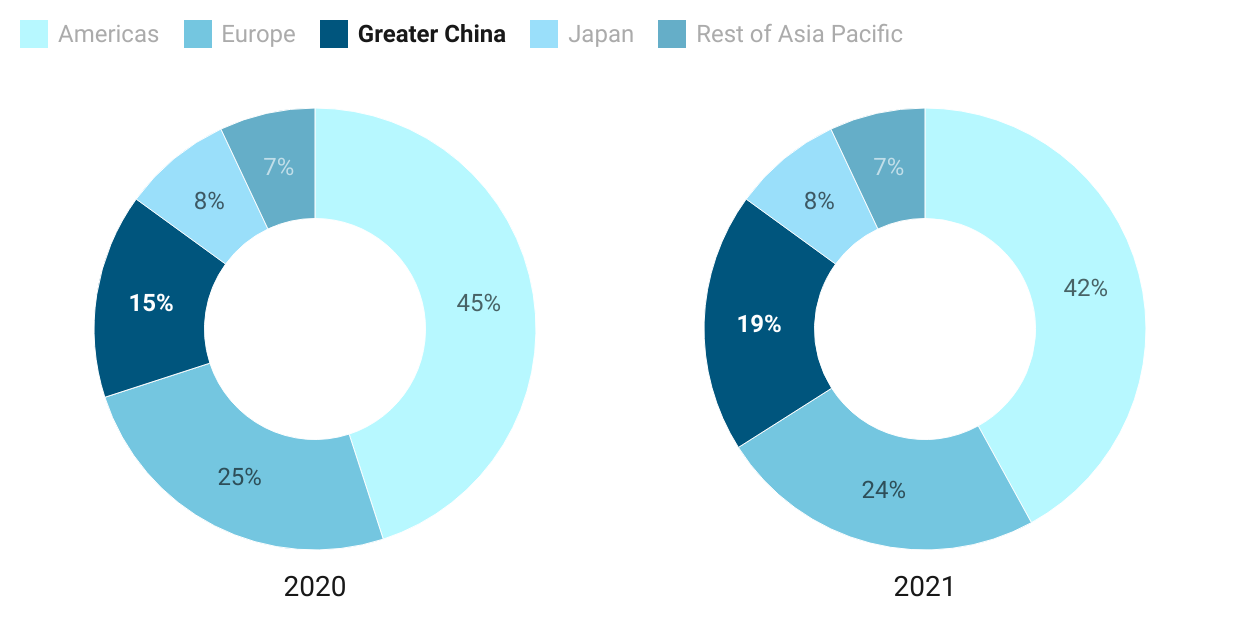
Revenue increase year on year in all regions. Strongest growth came from Greater China with growth of 69.6% vs an average of 27% in other regions. China alone saw revenue increase of $28 billion which accounts for nearly a third of the 2021's overall growth. It comes after two consecutive years of negative growth in the region.
Revenue By Country (billions)
| 2016 | 2017 | 2018 | 2019 | 2020 | 2021 | |
|---|---|---|---|---|---|---|
| Americas | $86.6 | $96.9 | $112.1 | $116.9 | $124.6 | $153.3 |
| Europe | $50 | $54.9 | $62.4 | $60.3 | $68.6 | $89.3 |
| Greater China | $48.5 | $44.8 | $51.9 | $43.7 | $40.3 | $68.4 |
| Japan | $16.9 | $17.7 | $21.7 | $21.5 | $21.4 | $28.5 |
| Asia Pacific (Rest) | $13.7 | $15.2 | $17.4 | $17.8 | $19.6 | $26.4 |
| Total | $215.6 | $229.2 | $265.6 | $260.2 | $274.5 | $365.8 |
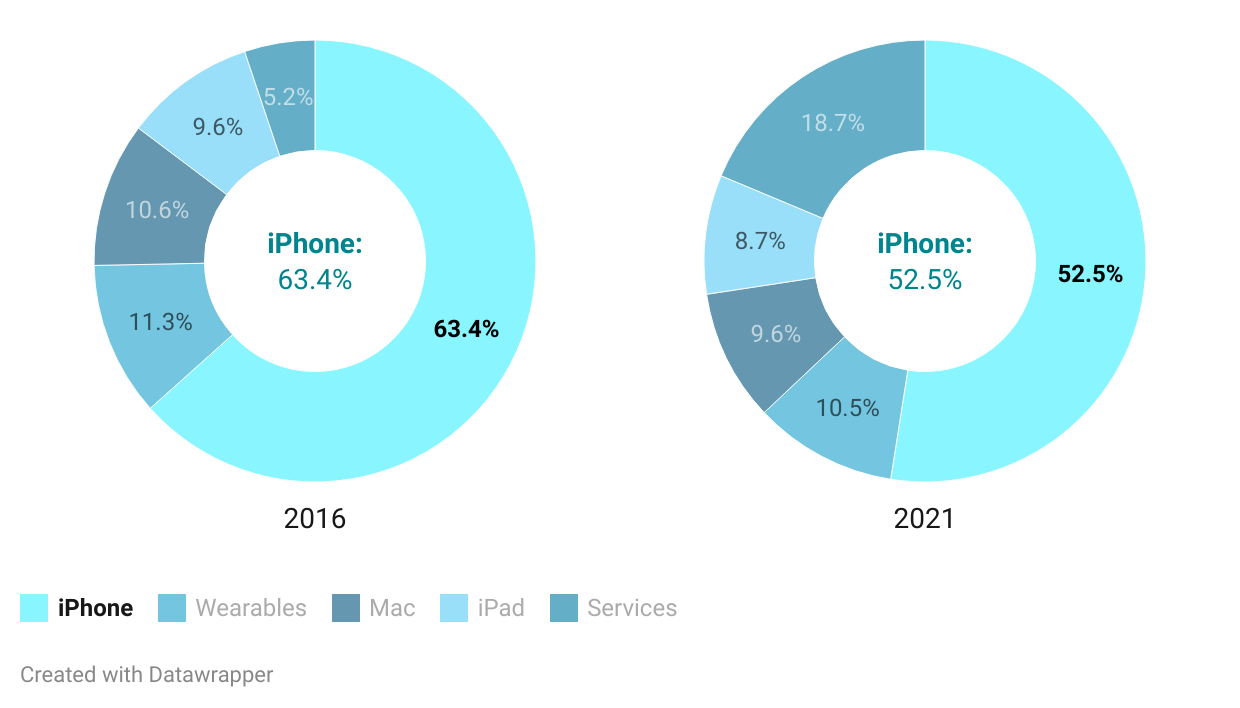
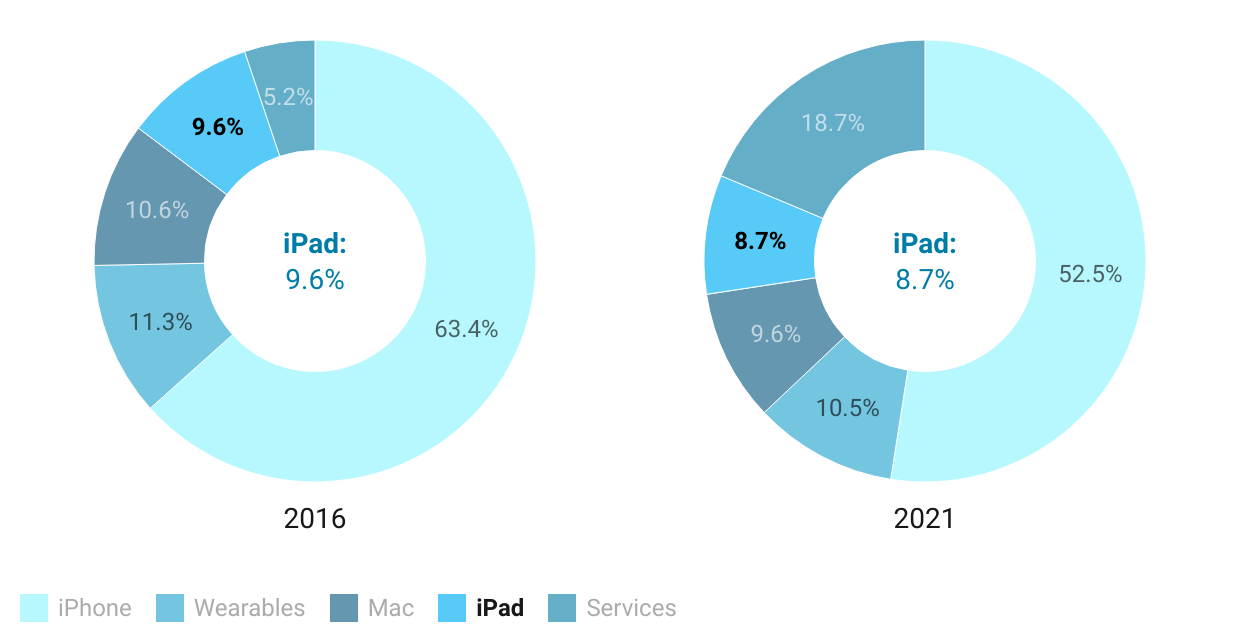
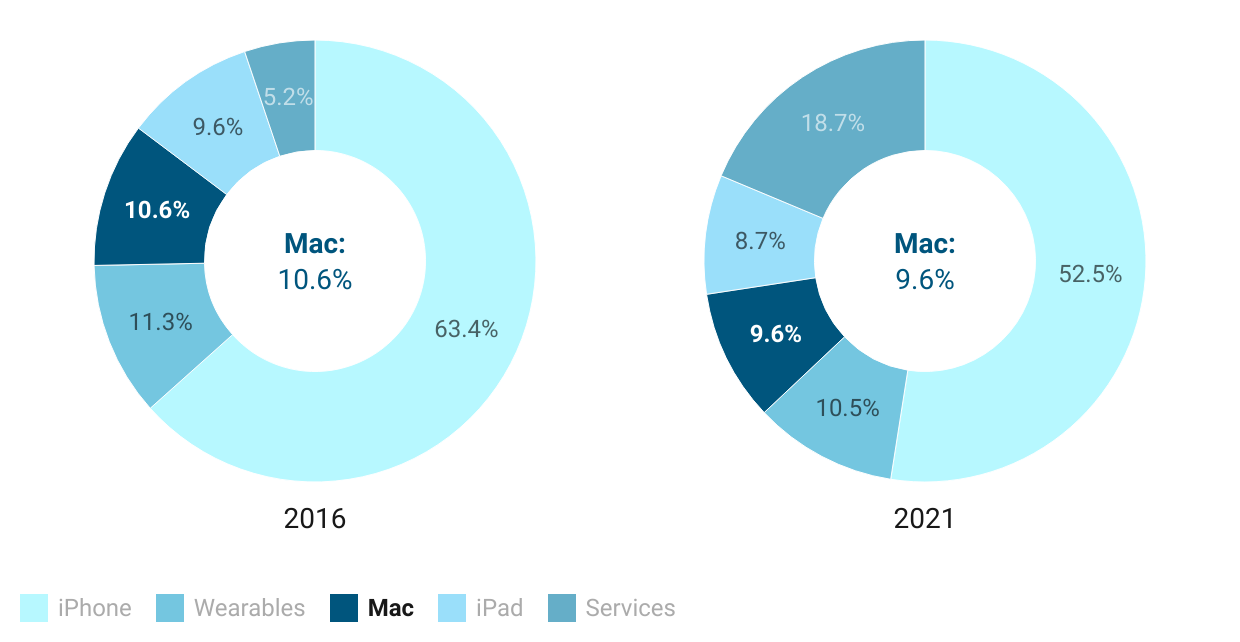
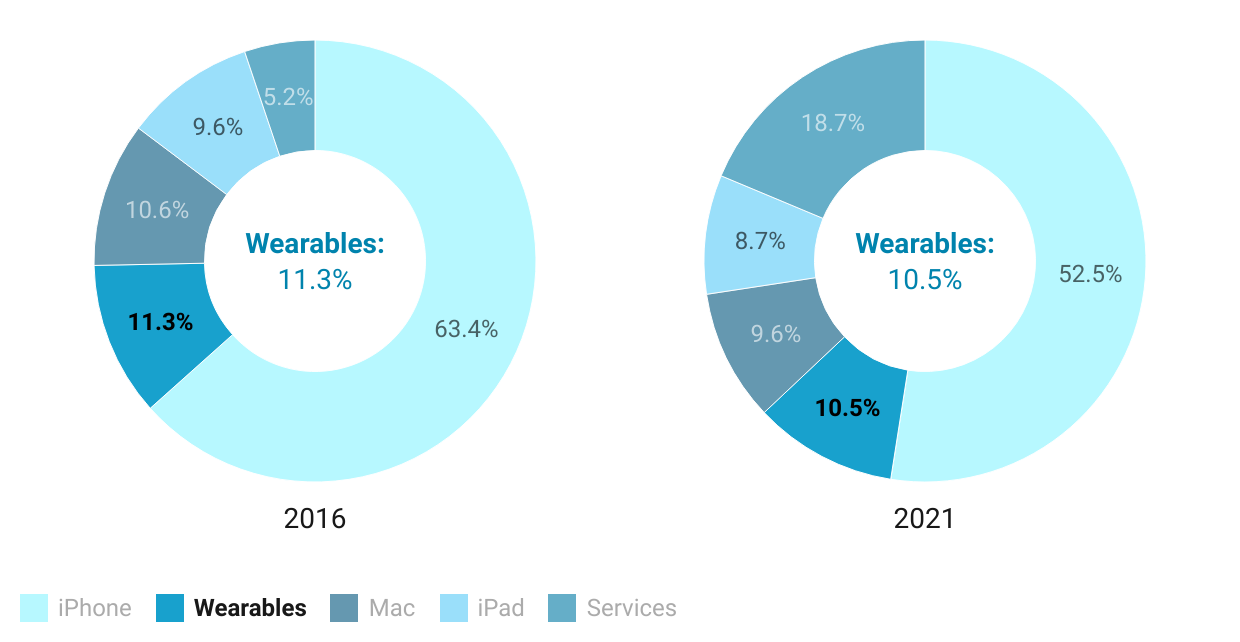
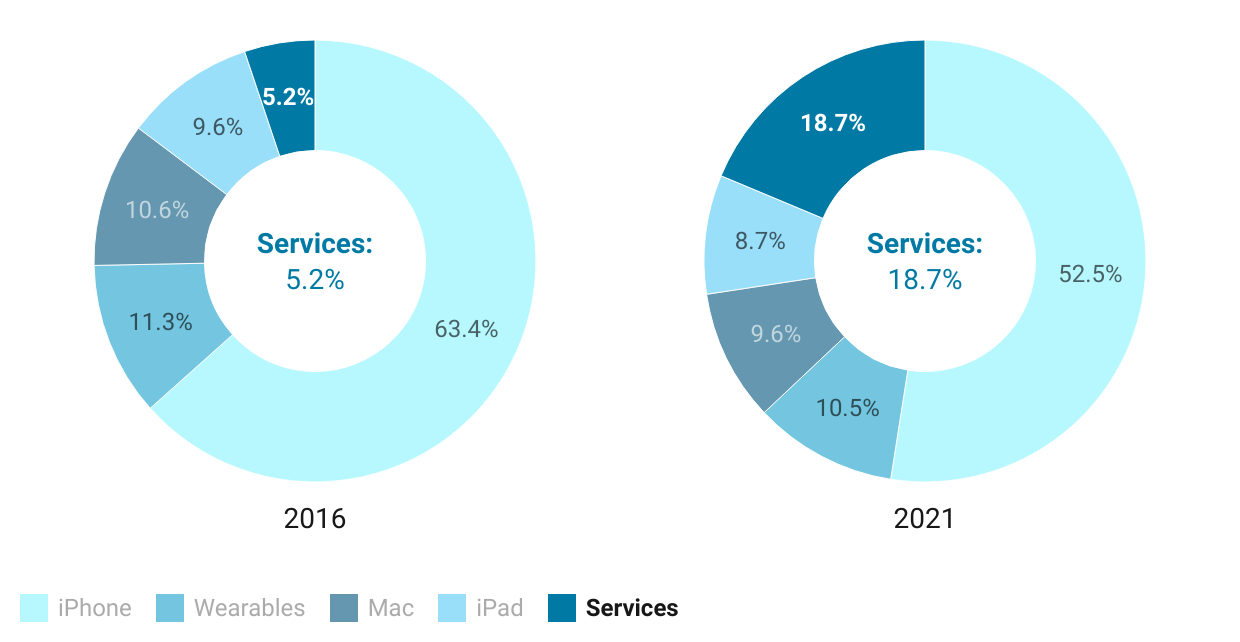
Apple Revenue By Product Line
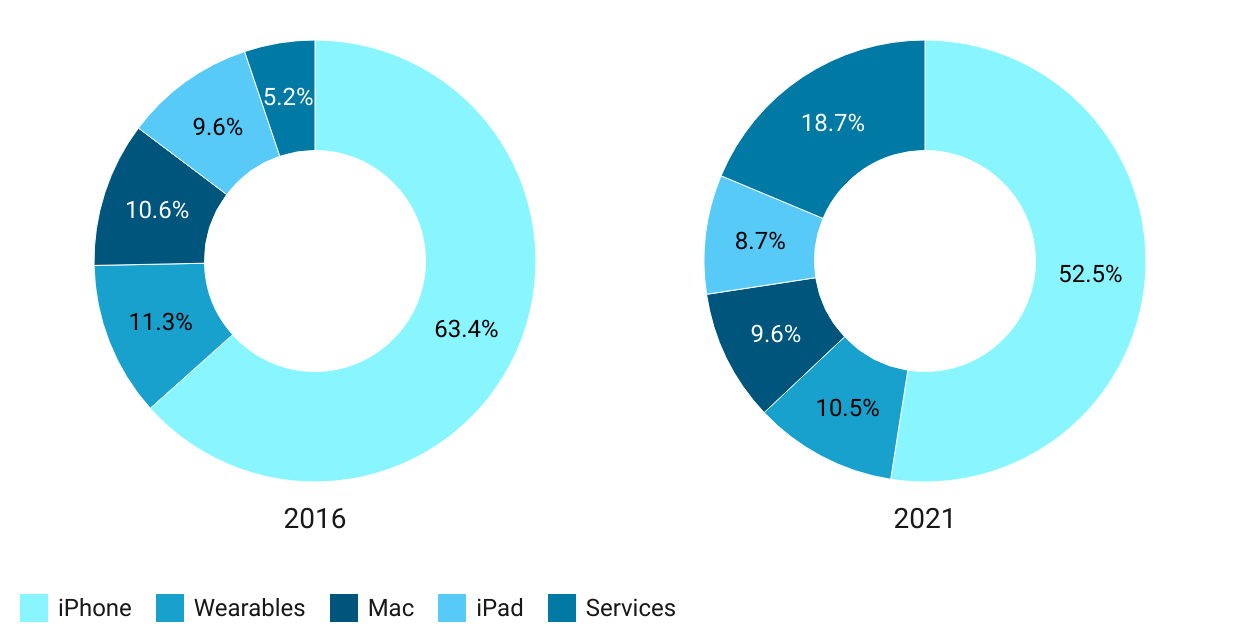
Over the past 5 years Apple has become less dependent on iPhone sales. In 2016 Apple relied on them to drive 63% of their revenue. While iPhone sales are higher in 2021, services revenue has dramatically increased.
Revenue by Product Line (billions)
| 2016 | 2017 | 2018 | 2019 | 2020 | 2021 | |
|---|---|---|---|---|---|---|
| iPhone | $136.7 | $141.3 | $166.7 | $142.4 | $137.8 | $192 |
| iPad | $20.6 | $19.2 | $18.8 | $21.3 | $23.8 | $31.9 |
| Mac | $22.8 | $25.9 | $25.5 | $25.7 | $28.6 | $35.2 |
| Wearables | $24.3 | $30 | $37.2 | $24.5 | $30.6 | $38.4 |
| Services | $11.1 | $12.9 | $17.4 | $46.3 | $53.8 | $68.4 |
iPhone Statistics
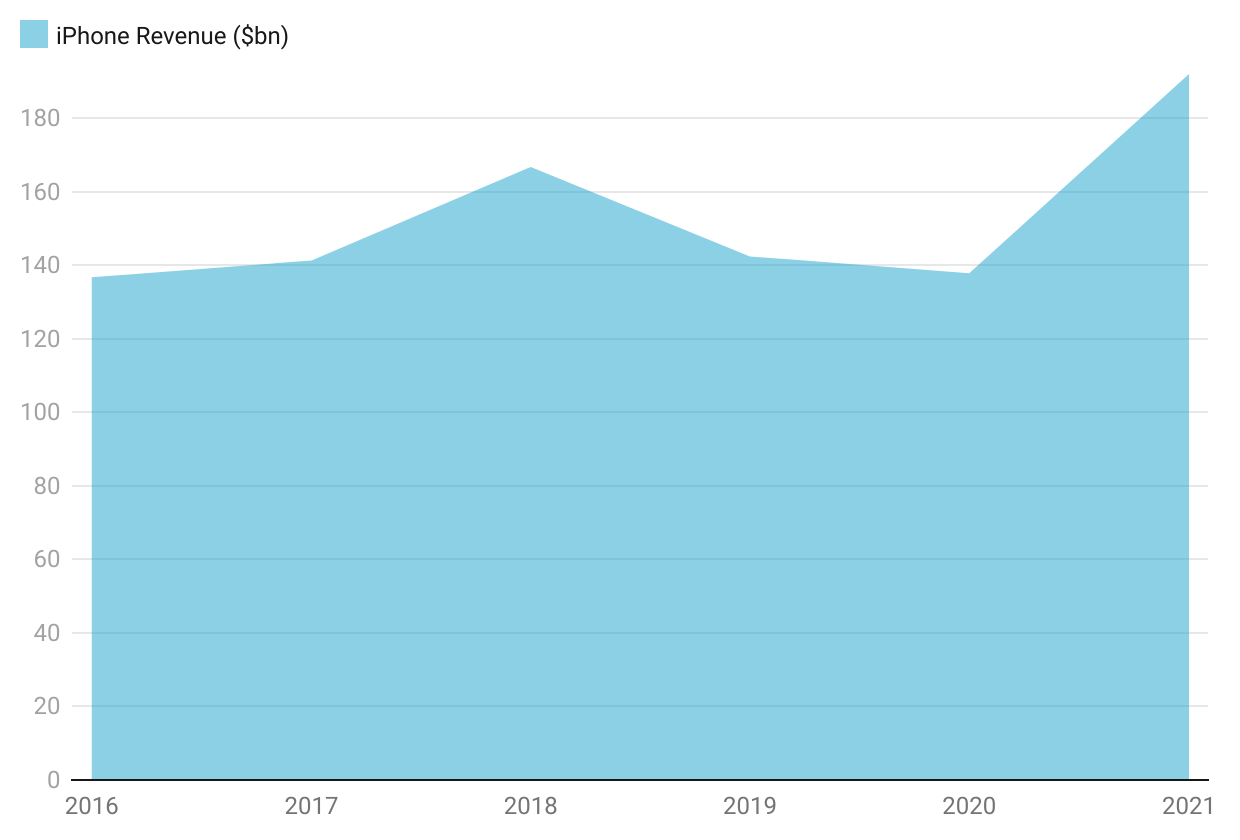
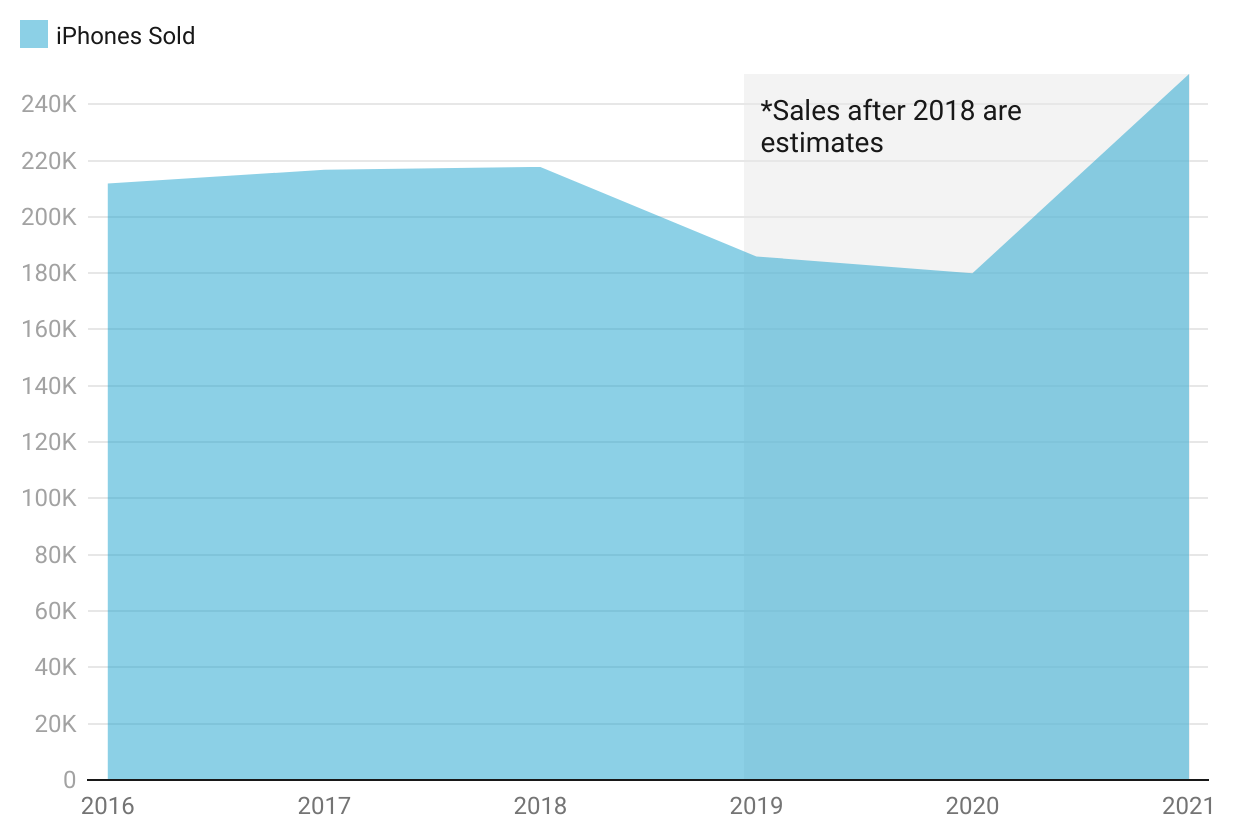
| Year | iPhones Sold | iPhone Revenue (bn) |
|---|---|---|
| 2016 | 211.8 million | $136.7 |
| 2017 | 216.8 million | $141.3 |
| 2018 | 217.7 million | $166.7 |
| 2019 | 186 million* | $142.4 |
| 2020 | 180 million* | $137.8 |
| 2021 | 250.7 million* | $192 |
*Apple continue to publish iPhone revenue but stopped publishing iPhone sales data after 2018. We have estimated the number of iPhones sold using the revenue number they continue to publish.
iPhone sales have risen by 40% between 2020 and 2021, which is great. When we zoom out, however, we see that they've only increased by about 40% since 2016. iPhone revenue had years of negative growth in 2019 and 2020, but it appears to have bounced back in 2021.
In light of Right to Repair legislation in the United States, it will be interesting to see how iPhone sales hold up. Right to Repair could make it easier and cheaper for people to fix their own iPhones, which could reduce the number of new iPhones sold each year.
It's also worth noting that iPhone sales make up a majority of Apple's revenue. In 2021, for example, iPhone revenue was still 52% of Apple's total revenue. This reliance on iPhone sales means that Apple is somewhat vulnerable to changes in the market. It's possible that this is why Apple has concentrated so much on their services revenue stream in recent years.
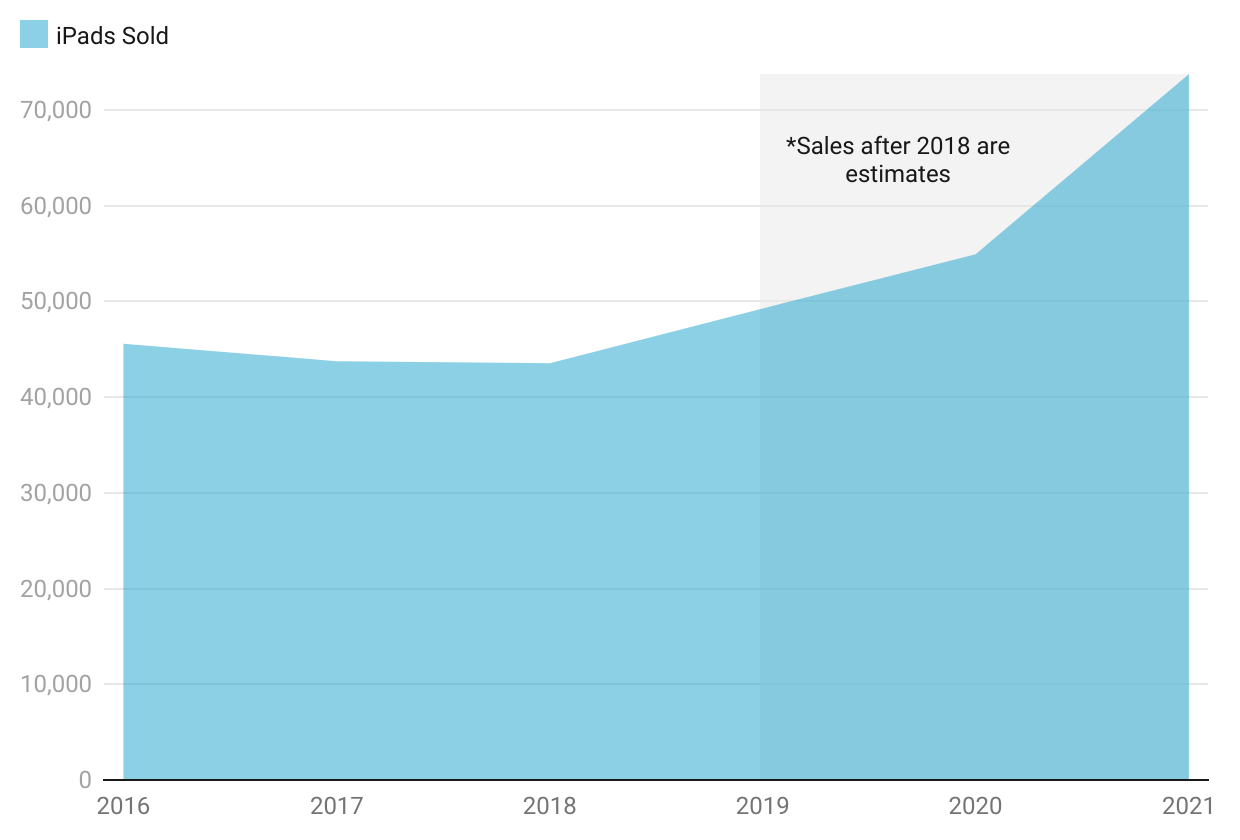
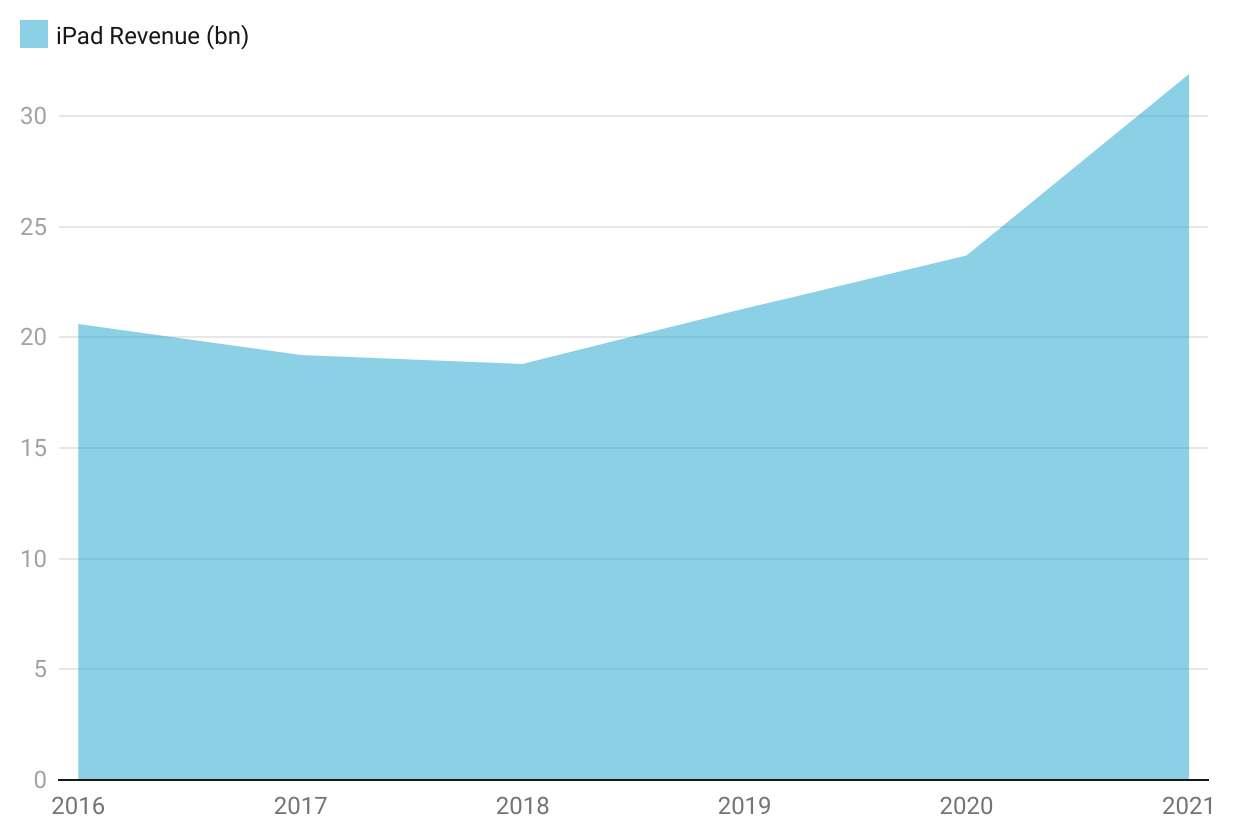
iPad Statistics
Revenue from the iPad made up ~9% of Apple's overall income in 2021. Since 2016, iPad sales have risen 54% vs 2021 and are up 23% year on year (2021 vs 2020). Apple's iPad sales revenue is comparable to that of its Macs, with the firm seeing just ~10% higher Mac revenue vs iPads in 2021. Their range now includes the iPad mini, iPad Pro and iPad Air.
| Year | iPads Sold | iPad Revenue (bn) |
|---|---|---|
| 2016 | 45.6 million | $20.6 |
| 2017 | 43.8 million | $19.2 |
| 2018 | 43.5 million | $18.8 |
| 2019 | 49.3 million* | $21.3 |
| 2020 | 54.9 million* | $23.7 |
| 2021 | 73.8 million* | $31.9 |
*Apple continues to publish iPad revenue, but stopped publishing iPad sales data after 2018. We have estimated the number of iPads sold using the revenue number they continue to publish.
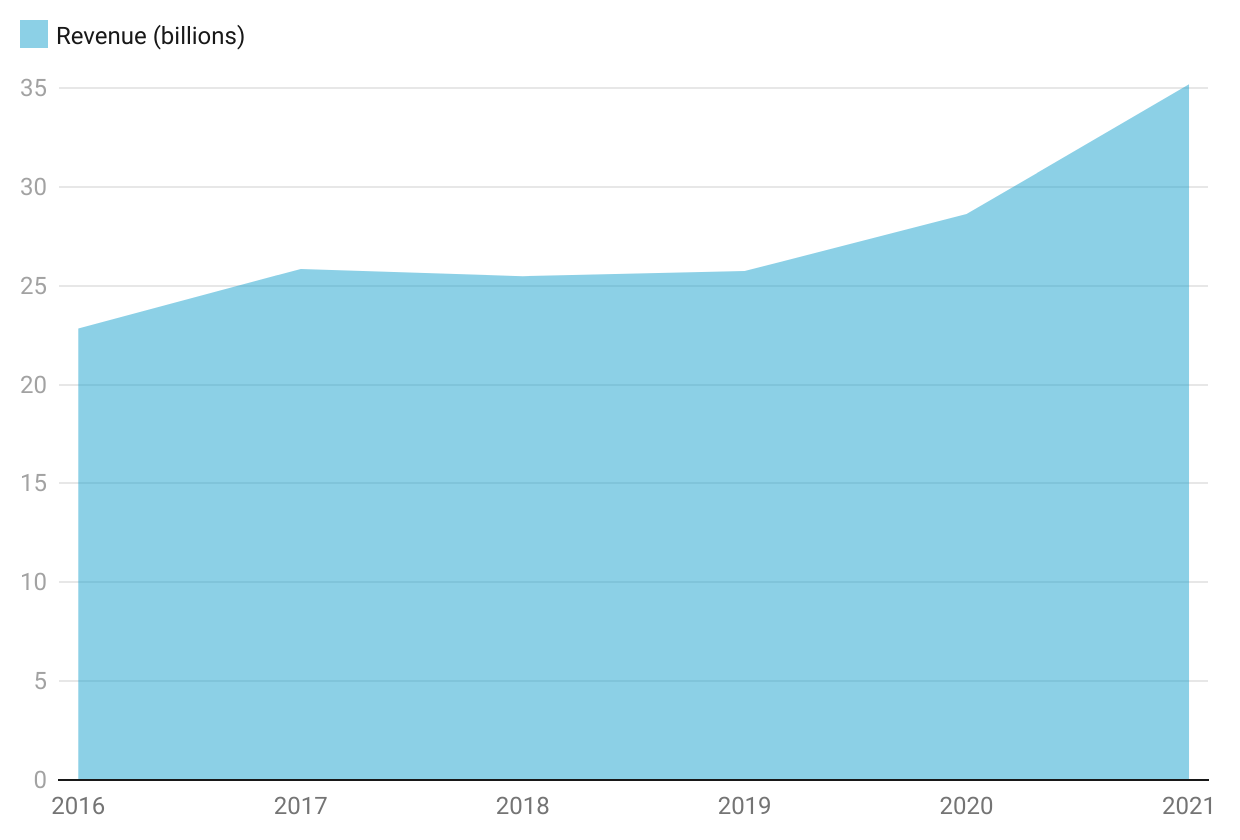
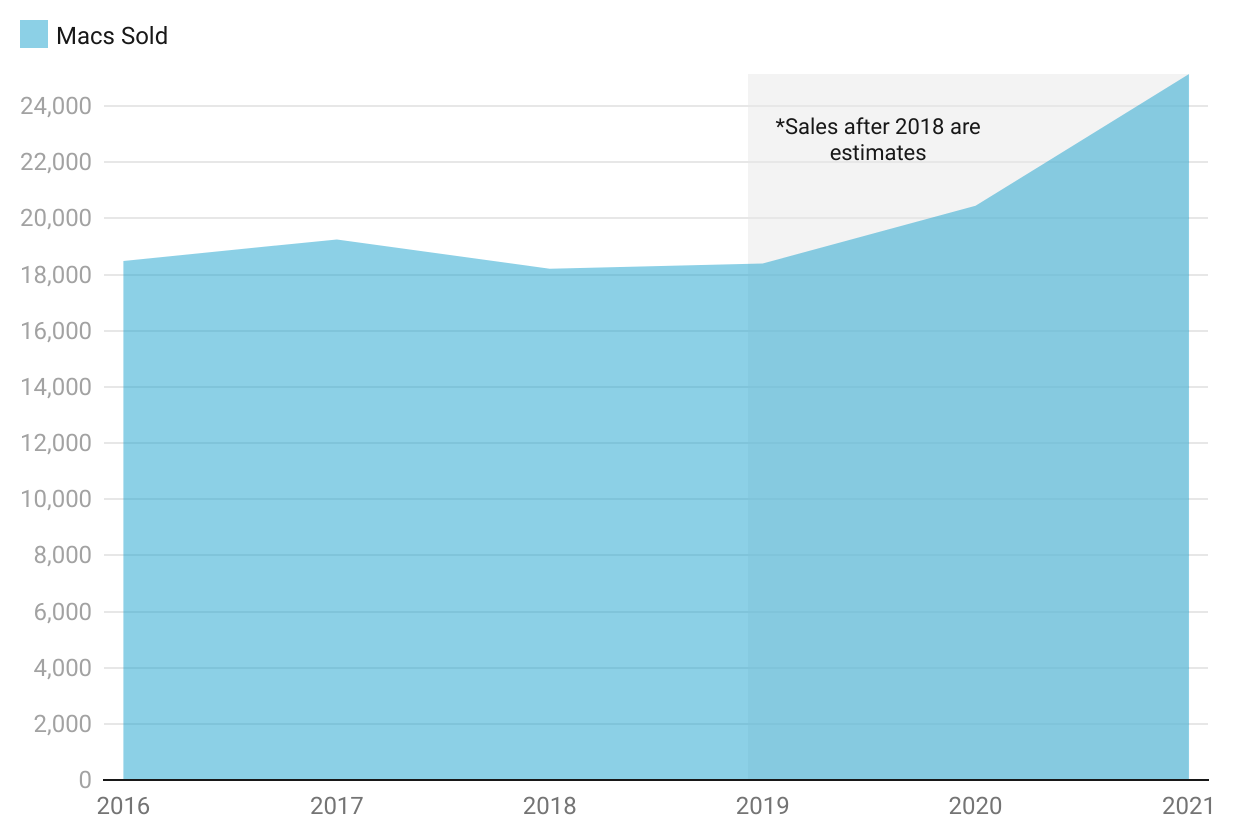
Mac Statistics
Mac revenue increased 23% in 2021 vs 2020 and despite this seemingly high growth rate, it is actually the lowest of Apples 5 revenue lines (iPhone, iPad, Mac, Services, Wearables). The companies mac revenue is up 53% in 2021 vs 2016 and represents strong growth in a competitive market. Mac revenue represented ~10% of Apple's total revenue in 2021.
The M1 was Apple's first chip designed in-house for the Mac. It was unveiled to the public for the first time in select MacBook Air, Mac mini, and MacBook Pro models in 10th November 2020. Since that time, multiple versions of the M1 chip have been released, including the M1 Pro, M1 Max and M1 ultra each of which contain a different number of transistors depending on its function.
| Year | Macs Sold | Mac Revenue (bn) |
|---|---|---|
| 2016 | 18.5 million | $22.8 |
| 2017 | 19.3 million | $25.9 |
| 2018 | 18.2 million | $25.5 |
| 2019 | 18.4 million* | $25.7 |
| 2020 | 20.5 million* | $28.6 |
| 2021 | 25.1 million* | $35.3 |
*In 2019, Apple discontinued releasing Mac sales data. We have derived the number of Macs sold based on the revenue number they continue to publish after that date.
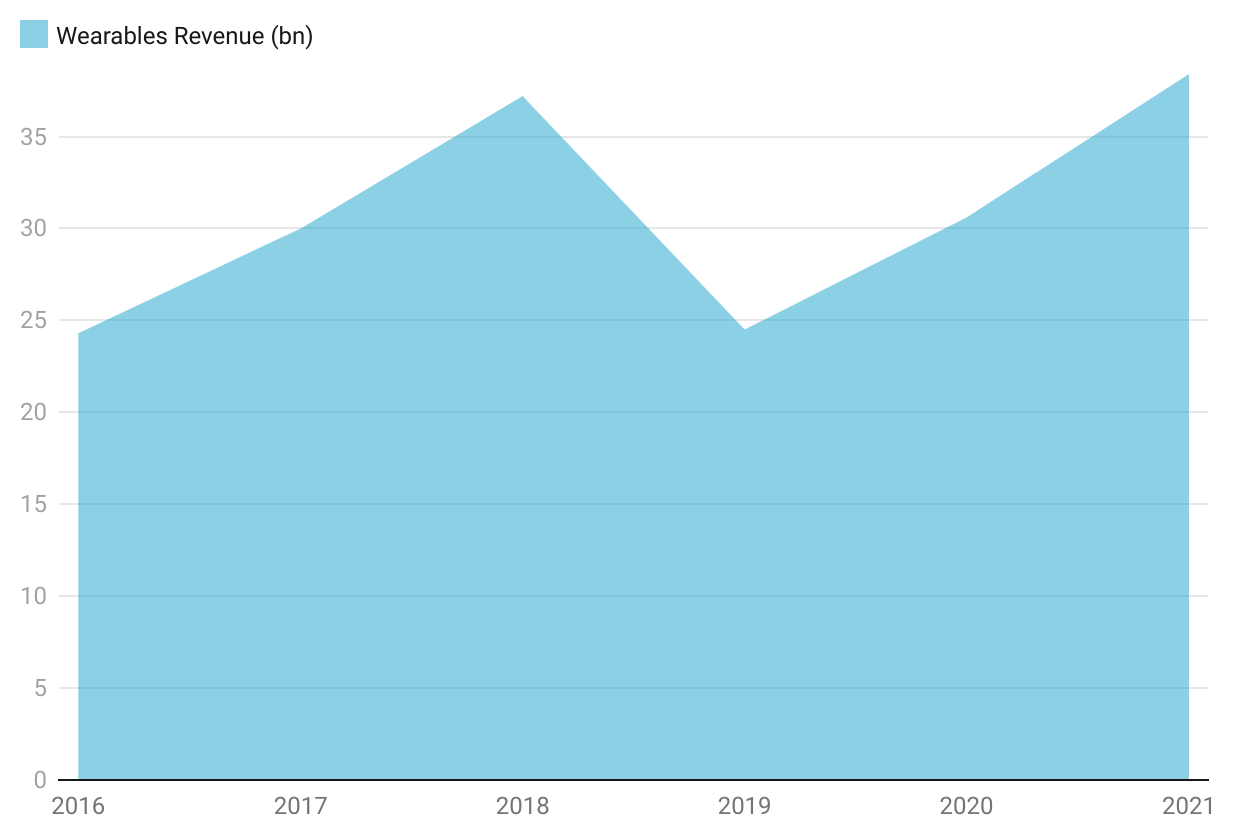
Wearables, Home And Accessories
Apple's ever-expanding range of wearables no includes Airpods, iPods, Apple TV, Apple Watch, Beats and the Homepod. Wearables revenue in 2021 is up 25% year on year and up 58% vs 2016.
| Year | Wearables Revenue (bn) |
|---|---|
| 2016 | $24.3 |
| 2017 | $30 |
| 2018 | $37.2 |
| 2019 | $24.5 |
| 2020 | $30.6 |
| 2021 | $38.4 |
Airpods Statistics
| Year | Sales |
|---|---|
| 2017 | 49.9 million |
| 2018 | 61.9 million |
| 2019 | 61.2 million |
| 2020 | 76.6 million |
| 2021 | 95.9 million |
Apple does not break out Airpod sales in their SEC reports but we have created these estimates based on the total revenue number they publish for their wearables line. Airpods were extremely popular from launch and have become one of the major players in the headphone market.
Beats
Beats was acquired by Apple in 2014 for $3 billion. Beats had strong growth in 2019, but its momentum appears to have slowed a bit in 2020 with revenue up just 5% YoY.
Apple TV
Apple TV+ has had a mixed start since its launch in November 2019. Although it has failed to live up to the hype of some of its competitors, it has managed to gain a loyal following among those who have subscribed.
Apple Watch
The Apple Watch was one of the companies early ventures outside of the iPod and iPhone. The watch has seen strong growth in recent years, becoming the best-selling smartwatch in the world.
Homepod
The Homepod, Apple's answer to the Amazon Echo and Google Home, has been met with mixed reviews. Some users love its design and sound quality, while others find it lacking in features and overpriced.
iPod
Apple discontinued the iPod touch in 2022. The iPod Nano and Shuffle were also discontinued. This leaves the iPod Classic as the only remaining iPod.
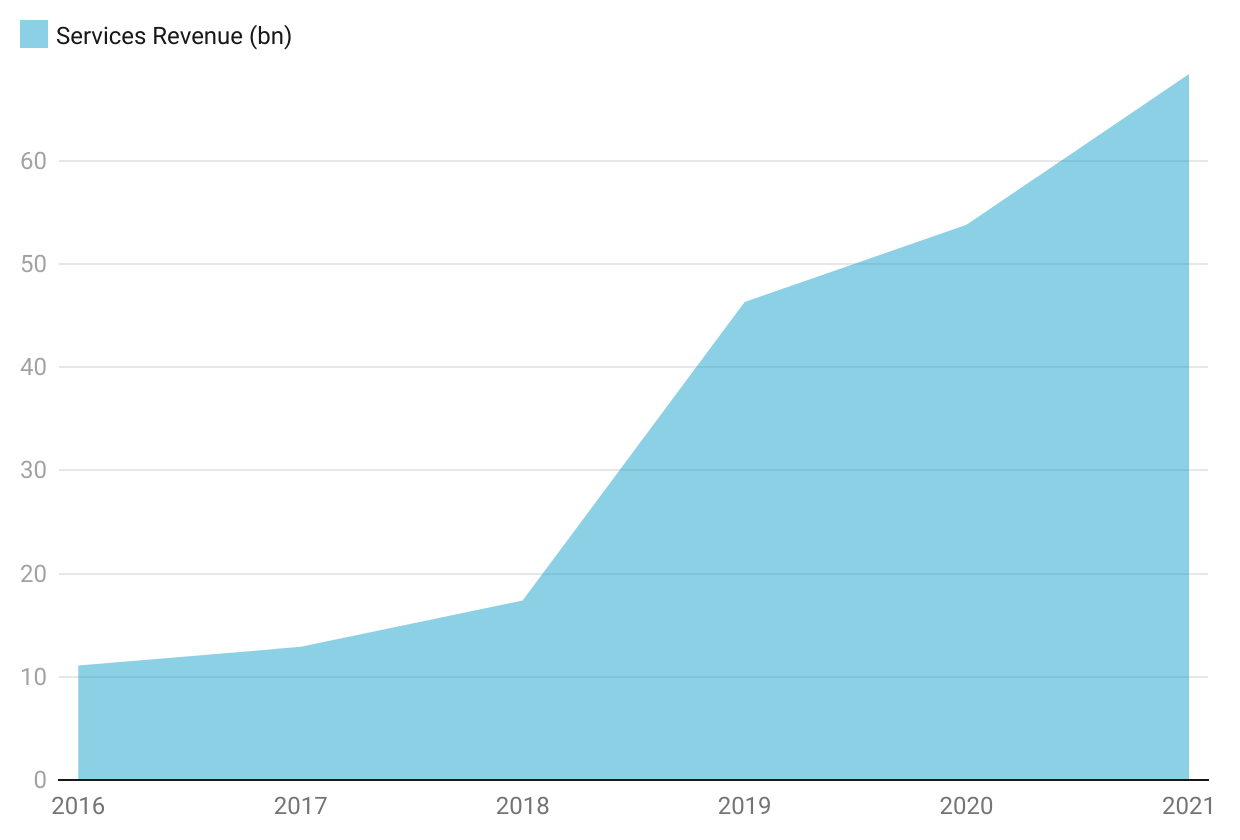
Services
Services in 2021 make up ~19% of Apples overall revenue, this is over triple what is was just 5 years prior. Apple services revenue in 2016 is up 515% vs 2016 and highlights the direction that many analysts think Apple are going. Apple is close to saturating the US cell phone market with iPhone meaning the company is looking elsewhere for growth.
Apple’s services business includes offerings like iCloud, Apple Music, App Store, AppleCare, Advertising, Digital Content, Apple Pay and the Apple Card. In 2022, Apple also launched its buy now pay later service for Apple Pay. The announcement was seen as a challenge to existing buy now pay later services such as Klarna, Afterpay and Affirm.
| Year | Services Revenue (bn) |
|---|---|
| 2016 | $11.1 |
| 2017 | $12.9 |
| 2018 | $17.4 |
| 2019 | $46.3 |
| 2020 | $53.8 |
| 2021 | $68.4 |
App Store
The App store allows users to browse and download apps developed with Apple's iOS software development kit. Apple often takes a cut of sales made through the App Store, which has been criticized by some developers as being too high.
Apple Music
Apple Music is a streaming music service that offers access to millions of songs. The company offers a monthly subscription service that allows users to download songs and albums for offline listening.
Advertising
Apple generates ad revenue from its app store where developers can pay to have their apps promoted on devices that are using their operating systems. A lot of sales are driven through its search ads which highlight advertiser's apps when users are searching for specific terms.
AppleCare
AppleCare is an extended warranty service that provides additional support for Apple products. The service includes coverage for hardware repairs and technical support.
iCloud
iCloud services allow users to store their music, photos, and other data in the cloud and access it from any device. iCloud also enables syncing between devices and allows developers to build apps that use iCloud to store data.
Apple Pay, Apple Card, Pay Later, Apple Wallet
Apple is making a major push into payment services with its Apple Pay system. The company also offers a credit card, called the Apple Card, and a financing option called Pay Later.
Apple was founded on April 1, 1976, by Steve Jobs, Steve Wozniak, and Ronald Wayne. The company originally started as a computer manufacturer and has since grown into a multinational technology company selling smartphones, tablets and laptops. Their popularity seems to reach new heights with each new product release and each of the products they launch often gain meaningful market share. The current CEO is Tim Cook.
Apple users are considered to be some of the most loyal in the world and are willing to pay a premium for Apple devices. Although retail stores still account for a large proportion of purchases, online retailers have been growing in popularity. The in-store experience allows Apple employees to enhance the buying experience by creating meaningful relationships with customers and providing expert product knowledge.