P-Value is a number between 0 and 100 that represents the probability of an event occurring. It is used in statistical hypothesis testing and tells us the strength of the evidence against the null hypothesis. If the P-value is low, that means the evidence against the null hypothesis is strong and vice versa. The p-value is used in hypothesis testing to help you make decisions about the strength of your data.
P-value Tips for Beginners
As a beginner just stepping into the world of Microsoft and starting your first Excel spreadsheet, we know it can be a bit overwhelming. While learning the different formats and formulas can be challenging, they enable you to work fast and more accurately in the future. P-values are just one of the many things you'll need to wrap your head around.
- P-values are used to determine whether data is statistically significant.
You can use the Data Analysis Toolpak to calculate P-values.
P-values are just one small piece of the Excel puzzle. However, understanding how to use them is essential for anyone who wants to work with data. You'll be a P-value pro in no time!
Ready to take your P-value skill level higher? Check out our P-value calculator and formula guide below.
What is a P-value Calculator?
A P-value calculator, or formula, is a tool that allows you to input data and calculates the P-value for that data. P-value calculators are available online and in many statistical software programs. You can use P-value calculators to calculate probability data for a variety of data types, including:
- Continuous data
- Categorical data
- Survival data
P-value calculators are a valuable tool for anyone working with data. P-value calculators can help you to:
- Understand the Probability Value concept
- Calculate P-values for your data
- Understand the statistical significance of your P-value result
Use The Data Analysis Toolpak to Calculate P-value Excel
To calculate P-Value in Excel, you need to use the Data Analysis Toolpak. The Data Analysis Toolpak is an Excel add-in that lets you perform statistical analysis on your data. To use the Data Analysis Toolpak, you need to first enable it. You can do this by selecting the tools dropdown, then Excel Add-inns and select the Analysis Toolpak.
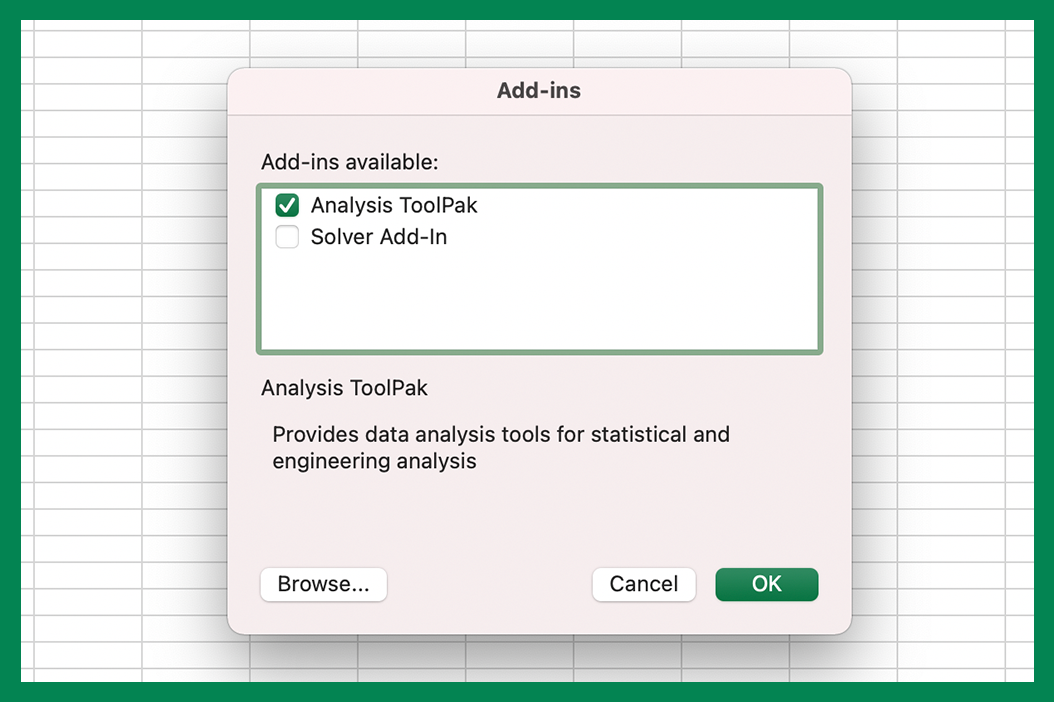
Save any documents you're working on, restart excel and Data Analysis should then appear in the Data Tab.
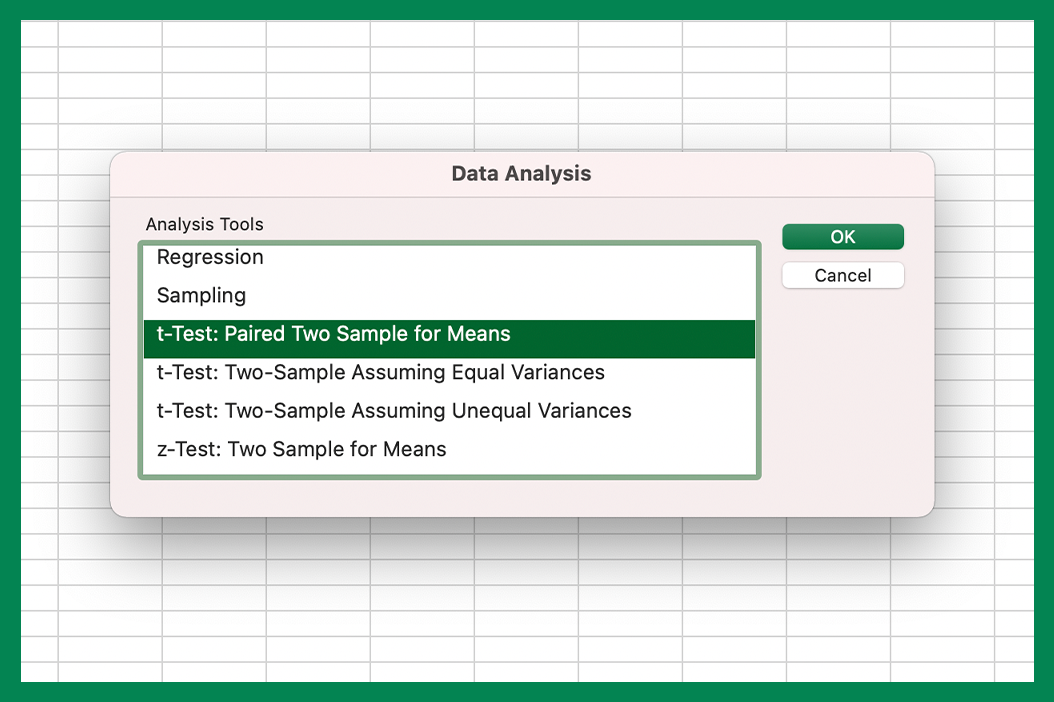
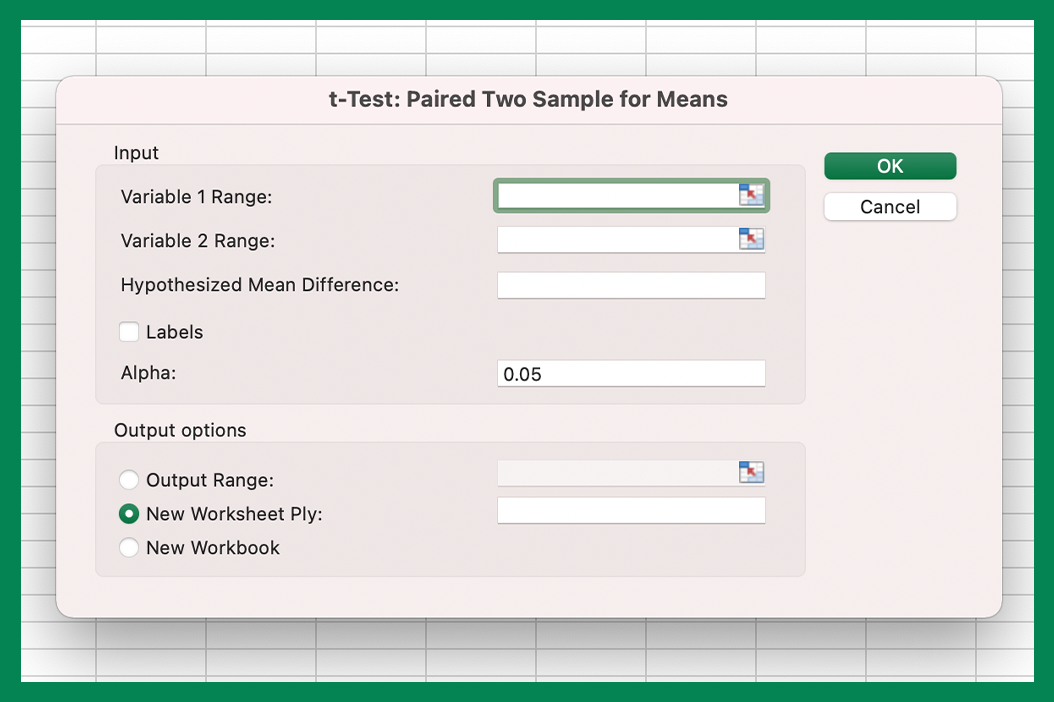
To do this, go to the Data tab and click on Data Analysis. Next, select the appropriate test type (t-test, z-test, etc.) and click OK. If you're looking for where to find P-Value - it will be displayed in the output range.
Tip: Where to find the Data Tab - The Data tab is located in the Ribbon at the top of the Excel window. If you don't see it, go to File > Options > Customize Ribbon and make sure the Data tab is selected.
What is a Data Analysis Tool?
Data analysis tools are software programs that let you input and perform statistical analysis on that data. Data analysis tools are available in many different statistical software programs. For example, a data analysis tool can be used to calculate Probability Values for various data types.
What is the t-Test tool?
The t-test is a statistical test that is used to compare two data sets. The t-test can be used to compare:
- Means
- Proportions
- Variances
The t-test is a parametric test, which means that it makes assumptions about the data. For example, the t-test assumes that the data is normally distributed.
The t-test is a two-tailed test, which means that it can be used to test for differences in either direction.
How to use the t-Test Tool Two-Sample Formula
To use the t-Test tool in Excel, select your data and click on Data Analysis. Next, select the t-Test function and then click on the two-sample assuming unequal variances option. P-Value will be displayed in the output of the two-sample formula. The t-Test function is used to compare two data sets, which is widely used today.
How to use the z-Test Tool
To use the z-Test tool, select your data and click on Data Analysis. Next, select z-Test and P-Value will be displayed in the output. The z-Test tool is used to compare two data sets and can be used for a variety of hypothesis tests.
Null Hypothesis
The null hypothesis is a statement that there is no difference between two groups. It is used in statistical testing to make decisions about your data. If the P-value is low, that means the evidence against the null hypothesis is strong and vice versa.
Using Excel Functions
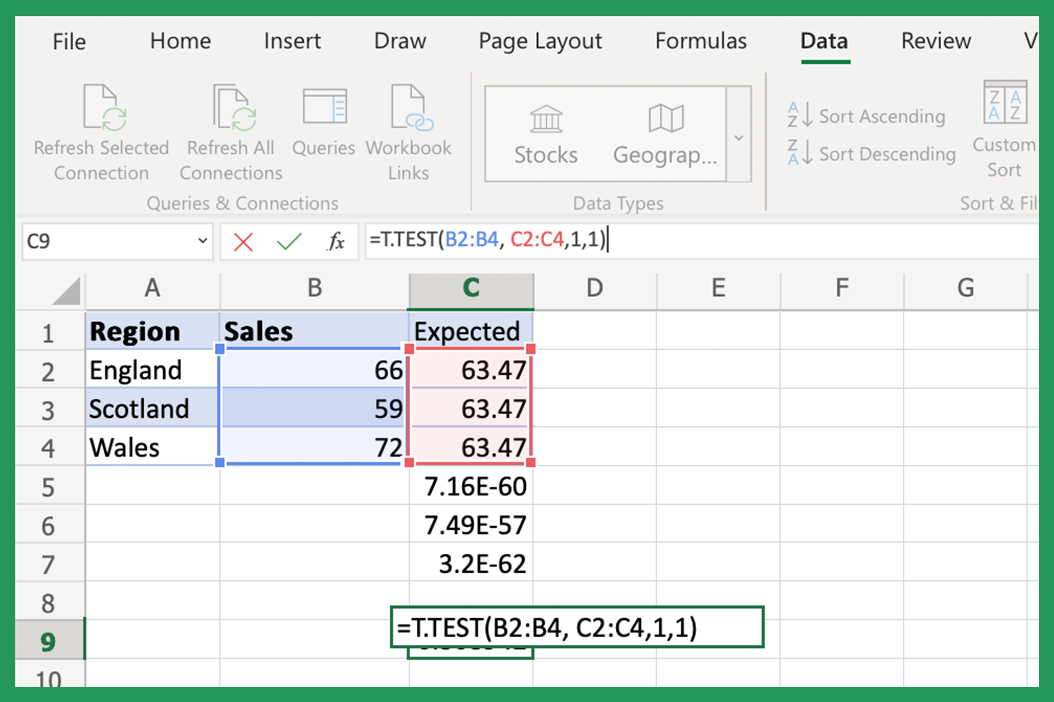
The second way to calculate P-Value in Excel is to use the function =T.DIST(x, degrees of freedom, tails). x is the value for which you want to calculate the P-Value. Degrees of freedom are the number of independent values in a sample. Tails are the number of tails in the distribution. P-Value will be displayed in the output.
Calculate P Value Online
P-Value can also be calculated using online P-Value calculators instead of Microsoft Excel. P-Value calculator websites allow you to input data and calculate P-Value based on the type of test (t-test, z-test, etc.) and the number of tails in the distribution.
The P-Value Formula & Arguments
P-Value is calculated using a formula. For example, the following formula is P=t/(t+z), where t is the t-statistic and z is the z-score. P-Value can also calculate p-value using this function.
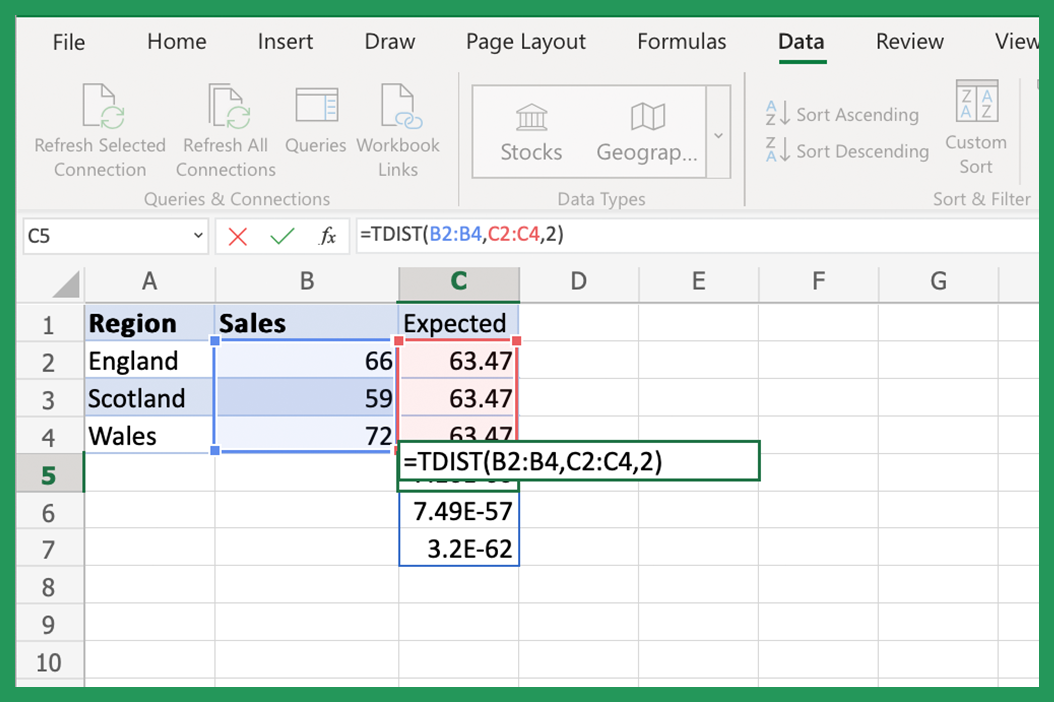
The P-Value function is: =TDIST(x, deg_freedom, tails). X is the value for which you want to calculate the P-Value. Degrees of freedom are the number of independent Probability data in a sample. Tails is the number of tails in the distribution. P-Value will be displayed in the output, depending on your current output options.
What is a P-Value Function?
P-value is a mathematical equation used to calculate the P-value of a data set. P-value is a statistical measure that represents the likelihood that a given result is due to chance. The formula itself is used to determine the P-value of a data set.
Considerations When Using P-Value in Excel
P-Value should be interpreted in the context of the problem. Due to the nature of the simple formula and what it's typically used for, P-Value should never be used to make a decision by itself.
Hypothesis Testing
When P-Value is used in the testing of a hypothesis, P-Value can be either one-tailed testing or two-tailed testing. P-Value can also be represented as a percentage or a decimal number. One-tailed P-Values are usually written as a percentage, and two-tailed P-Values are usually written as a decimal number.
Distribution Tails
What is One-Tailed Distribution?
A one-tailed distribution is a statistical distribution where the P-value is divided into two parts. The first part of the one-tail test is the P-value for the null hypothesis, and the second part is the P-value for the alternative hypothesis.
What is Two-Tailed Distribution?
A two-tailed distribution is a statistical distribution where the P-value is not divided into two parts. For example, in a two-tail test, the P-value for the null hypothesis and the P-value for the alternative hypothesis are both represented by the P-value.
P-Value & Type I Error
P-Value is related to Type I Error. Type I Error is the error that occurs when you reject the null hypothesis when it is true. P-Value is the probability of Type I Error. P-Value is used to calculate the likelihood of Type I Error.
Alternative Hypothesis Testing
P-Value can also be used in alternative hypothesis testing. In this type of testing, P-Value is used to compare the results of the two groups. P-Value is used to decide if the two groups have a highly significant difference. P-Value is usually represented as a decimal in alternative testing. P-Value is also used to calculate the power of the test.
Significance Level
The significance level is the probability of rejecting the null hypothesis when it is true. It is also known as alpha. The alpha for P-Value is 0.05. This means that there is a 95% chance of accepting the hypothesis when it is true. As we've mentioned previously, P-Value alone should never be relied upon to make a decision.
What is an Alpha Value?
The alpha value is the level of significance in a statistical test. For example, the alpha value for P-value is 0.05, which is that default value you can see in the alpha text box.
Things to Know About p-Value in Excel
Here is a useful summary regarding p-value calculations in Excel.
- P-Value is a number between 0 and 100 representing the probability of an event occurring.
- The P-value tells us the strength of the evidence against the null hypothesis.
- If the P-value is low, the evidence against the null hypothesis is strong and vice versa.
- The P-value is used in the testing of a hypothesis to help you make decisions about your data set.
Does P-value work in older versions of Excel?
The P-Value function was introduced in Excel 2010. However, P-value can be calculated in older versions of Excel using the Data Analysis Toolpak. The Data Analysis Toolpak is an add-in for Excel that you can use to perform a statistical detailed analysis.
Will P-value work in new versions of Excel?
P-Value is available in all new versions of Excel. In addition, P-Value can also be calculated using the Data Analysis Toolpak, for example, in recent versions of Excel.
What is P-value Stand for?
P-Value stands for Probability Value and is a number that represents the probability of an event occurring. Probability Value is used in many different types of testing and is widely used in statistical testing of hypotheses.
Benefits of Using P-value in Excel
P-value is a quick and easy way to calculate the probability of an event occurring. P-value can be used to make decisions about your data set. In addition, the probability value is a useful tool for testing of hypothesis. P-value can be used in all versions of Excel.
P-Value Resources
- Calculator
- Formula
- Function
- Data Analysis Toolpak
P value = 0.00048 (two-tailed)
Probability tools are used as a way of measuring evidence. The smaller the P-value, the stronger the evidence against the null hypothesis.
In this case, the P-value is very small, so there is strong evidence against the null hypothesis. This means that we can reject the null hypothesis and conclude that there is a statistically significant difference between the two groups.
What does PValue Excel mean in practical terms?
For example, Probability is often used to decide whether a new medical treatment is effective. In this typical case, a P-value of 0.05 would mean that there is a five percent chance that the new treatment is no better than the old one.
You can also use probability to decide whether a difference between two groups is statistically significant. In this case, a P-value of 0.05 would mean that there is a five percent chance that the difference between the two groups is due to chance.
Conclusion
Do you have any questions about P-Value? Leave a comment below, and we will do our best to answer your questions.
Thank you for reading! We hope this was helpful. If you have any questions, please message us on the Contact page.